Predictive marketing: the genie is out of the bottle

Predictive analytics is undeniably key for today’s marketing professional to gain insights that help grow businesses. A recent survey revealed that companies that rate themselves substantially ahead of their peers in their use of data are three times more likely to rate themselves as equally ahead in financial performance.

Predictive marketing provides value to everyone from analyst to technology experts to web content managers in all industries. Here are just a few examples:

  • A web experience manager can see how long an article should remain on a site before the content needs to be refreshed.
  • Analysts can determine which customer actions are most likely to lead to conversion.
  • Advertisers can predict the triggers for increasing click-through rates
  • A social media manager can forecast the sentiment of a specific twitter post as well as the optimal time to post a particular tweet during a time of a week.

While there is growing awareness of these advantages, predictive marketing has not become a mainstream tool. Let’s take a look at what predictive marketing can do for a retail outlet. As a marketing manager, imagine a photograph of a person with a shopping cart walking down an aisle packed with produce. What would be the most interesting analytical data one could get out of this? Looking at the shelves to see what products are depleted for forecasting? It is pretty obvious that one can track inventory using sophisticated supply chain management techniques but that’s not predictive marketing.

retail

Predictive marketing would analyze the shoppers receipt. By looking at receipts, we can determine what the shopper’s needs and wants are. What items and how many items does the shopper typically buy? Is there a preference for self-checkout lanes or full service? Is there a time of day preference? Is there brand loyalty or price sensitivity? Are payments by cash or using a debit card, or using a credit card with a reward incentive? We may even be able to assess the shopper’s attitude toward privacy—is the name, phone number or address printed on the receipt?

gartner

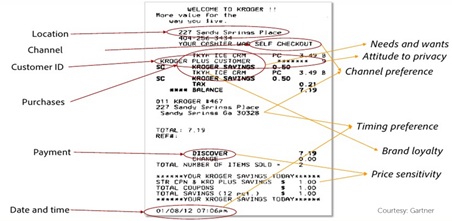
Analyzing all this data enables marketers to make very useful predictions about what this shopper may do in the future, and as the number of receipts for this shopper increases, and as the receipts for all shoppers are aggregated, the ability to make predictions about individual and group behavior increases, enabling highly targeted marketing campaigns.

So how do you get started? First, you need to recognize that predictive analytics is not where you will start your analytics journey. The first step is always to get “street smart” about your data.

What should you be collecting and how should you do it? How should you be modelling data? Once you understand this, you can begin to make incremental investments in your infrastructure to support data integration—bringing all the different data sources together—and then look for an analytics software solution in order to start creating the algorithms you’ll need for prediction. I have covered several of these topics in previous blogs

analytics pyramid

Not too long ago we were excited about deconstructing the deluge of data in terms of volume, variety and velocity… Now we have arrived at a point where extracting optimum value from data means figuring out the buying behaviors next week, next season, next year. Exciting times to be in analytics.

If you are interested in deeper discussions about your specific analytics needs, you can reach me at Twitter: @shree_dandekar

Advertisement

Adoption of social analytics beyond the obvious – Are we there yet? No!

Customer conversations at Clarabridge C3 conference last month made it painfully obvious: Businesses are hungry for analytics yet often struggle to see the application of text analytics beyond analyzing survey and customer experience data. While that’s not bad, there is so much more that can be done to harness the power of data analytics for example to track brand reputation in real-time.

C3 event

Simply put: Text Analytics is Text Analytics is Text analytics! It’s not a technology leap, it’s the application of the technology to new sets of data like social media and new sets of questions/queries, that business might not have considered before. This data packs the potential to derive insights that enable businesses to remain competitive à the crux is in the query.

In my conversations with fellow attendees, I found that many are already advanced in their analytics maturity since they are using a text analytics platform and now crave to expand their use cases to derive insights for their business, for example they want to:

  • Understand and proactively engage on what is being said about their brand, industry, competitors, products, etc.
  • Improve customer relationships via social media

In many cases they have the tools and might only require a change in mindset to realize the full potential of social media analytics. It’s incumbent upon todays CIO to educate the business stakeholders to expand the company’s analytic capabilities to include social media analytics as an essential ingredient in their business growth strategy.

But before that’s possible let’s take a look at the journey. Whenever we talk to businesses about their social media analytics strategy we talk about a journey that begins by listening to customers, then collecting and recording the data, analyzing it, applying heuristics and business algorithms to the data to derive actionable insights from it. Essentially this means going from an ad-hoc approach to a highly optimized analytics solution. These capabilities do not get built overnight but in increments as the business develops analytics maturity. One important point to note here is that businesses not only have to make the right technology investments but also have to invest in training personnel and creating a social media analytics culture within the organization.

Social media analytics journey

Thinking back about my conversations at the conference it was obvious that many businesses are ready to harness the power of social analytics beyond the text analytics investments have and ask questions they never dreamed of before.

SXSW 2013: Hot chocolate and the art of Social Media analytics

Swissmiss is what I fix for my son every morning for breakfast. Then came SXSW 2013. @Swissmiss took on a whole new meaning for me. The fusion of high tech and art eloquently presented in Tina Roth Eisenberg’s keynote at SXSW took me completely by surprise – in a very good way.

I went to my first SXSW Interactive event on a work assignment. My expectations were mixed in that I felt there was probably a lot of hype. So much about expectations… until it hit me during Eisenberg’s keynote. Her ability to present to a large audience and yet create an immediate personal connection with me was a real eye opening moment.

Social media in the private and the professional sphere intimately connects digital technologies, software and people in all their individual facets. Eisenberg herself personified the fusion of the personal with the professional, hitting on the very essence of how social media MUST work. For me professionally that understanding is key to evolving social media analytics strategy for a business.

What might seem obvious to some, in a few days, re-shaped my outlook in terms of the power of social analytics for businesses. At SXSW, this lens allowed me to see the g….ap that still exists between how to capture social data in a meaningful way and converting it into actionable insights that move the needle.

As in any conference there were sessions whose titles sounded ground breaking but ended up being duds. There was a lot of talk about seeming opposites – the fun Vs. the measurement of Social media. While these two might seem to be on the opposing ends of the spectrum they really are not. The ability for a business to derive real time social metrics from a day-to-day “fun” conversation intertwines these opposing themes. That’s where the true value of a real-time brand reputation analytics capability lies.

Today, capabilities like that exist, but in order to realize their full potential, businesses need to start making that investment NOW!

Social Wordle

Going back to the framework of seemingly opposing concepts, one of my main take away from SXSW 2013 can be boiled down to this. My son is an artist, I am an engineer. At this year’s SXSW I saw the amazing potential in the fusion of these two seemingly opposing fields.

Data Anarchy – A real threat to Self-Service BI (Part 2)

HOW DID WE GET INTO THIS MESS?

The possibility of Data Anarchy is real. It can creep up on you slowly and overwhelm an IT department easily. While getting out of that mess is a good idea, it is way better to avoid getting in it in the first place.  That, of course, presumes that we can recognize the early signs. So, how and why does data get out of control?

Industry dynamics are contributing to data craziness – are you surprised?

Companies are becoming more BI and analytics savvy and are collecting more data because it is cheap to store data. They are turning to their day-to-day business data to glean insights that will help them stay competitive that is to better understand their own business in terms of product performance, customer behavior, demographics etc. In an effort to improve how they do business, an Austin-based hotel scheduling company  is collecting large web click data daily so that it can start performing historical trend analyses and decide their future ad campaigns.

As hardware costs continue to spiral down, commoditized storage continues to spark data hoarding. Today companies are realizing that it is very economical to store and retain data over a longer period of time. Today’s data retention solutions are also offering ways to not only store multiple varieties of data (including structured, semi-structured and un-structured) in an efficient manner but also providing front end tools to mine the data in the future. For example, the IT manager in one of the large biomedical testing labs recently decided to start storing multiple TBs of semi-structured data getting logged by 7000 sensors worldwide. Previously the data used to get flushed away on a daily basis.

Another phenomenon that is driving the explosion of data is the use of social media. Businesses are already looking at ways to build sentiment analysis applications to analyze social conversations and in that process are starting to capture social content on a regular basis.

Business Intelligence (BI) tool evolution – shiny new tools are tempting

BI tools have come a long way. Traditional BI tools were extremely good at tracking raw transactional numbers like sales figures and profit margins but failed to adequately address the root causes, or drivers, of trends in those numbers. Moreover, they were typically able to tell what happened (backward reporting) – but not explain why (unless it was evident in some other numeric data) let alone alert the business as a change emerges. The tools were complicated to deploy and operate. Users wanted self-service BI.

Over time, BI tools have evolved to support features like auto-modeling techniques, rich visualizations, metrics and auto-calculations on the fly as well as “What if” analysis. Tools now boast new in-memory technologies to enable users to quickly port data sets into memory to crank out insights quickly, thus enabling self-service BI.

End user evolution – we change, we demand more, we want it faster

The user dynamics are changing from IT controlled to end-user driven self-service led analytics. (In this time of the i-everything, BI users demand iBI – the easy, cheap and fast magic answer box.)

Traditionally IT managers were responsible for adopting the right reporting tools and giving the end-users access to consume the reports. Typically in an organization 80% of the people were consumers of data1 while the remaining 20% were actually creators of ad-hoc reports and custom dashboards. That model worked for a while but the balance of information consumers and information creator s shifted significantly. The effects of this shift manifest themselves differently for enterprises and SMB’s.

Most SMB customers fall in the category of casual data access using simple tools like Excel for their day-to-day analyses and are in dire need of self-service BI tools to help them migrate to the next level of analytics maturity. Typical SMB customers are characterized by limited IT resources and budgetary constraints which is driving them to the use of these easy to use and faster to deploy self-service tools.

Departmental IT’s within traditional enterprises are responsible for disrupting the BI ecosystem already put in place by corporate IT. The complexity and inertia of the current BI situation for end users has led to an increasing need for Self-service enabled BI tools. Users simply demand the democratization of the BI tools to gain quick and meaningful insights.

Changing IT demands – they want to help us. Really!

Democratization of BI is a thorn in the side of IT. Per IDC Digital Universe study (2011) the amount of data being stored is more than doubling every two years, and could grow by 50X by 2020 while IT staff is estimated to grow at 1.5X only! This shocking statistic in itself should be a cause of concern for today’s IT managers. Thus in addition to designing the next generation data architectures, IT managers will also need to make sure that they can disseminate this information to the business users in a easily digestible manner.

IT is still challenged with maintaining a “single version of truth” while supporting day-to-day BI needs. Today most of the IT departments within traditional enterprises have already started defining a master data framework for maintaining an authoritative, reliable, sustainable, accurate, and secure data environment that represents a “single and holistic version of the truth”. IT managers recognize the following components as the critical pieces to architecting a robust Master Data Management (MDM) framework: Customer Information File (CIF), Product Masters (BOM), Extract, Transform, and Load (ETL) architectures, Enterprise Data Warehouse (EDW), Operational Data Store (ODS), Data Quality (DQ) technologies and Enterprise Information aggregators. What is missing from this framework is the need to acknowledge the new evolving self-service enabled, in-memory BI data stores.

Next time,  let’s see what we can do about this…Stay tuned!

References

[1] The Myth of Self-service BI [Wayne Eckerson, TDWI  What Works Enterprise Business Intelligence v24]

Data Anarchy – A real threat to Self-Service BI (Part 1)

In this post series I examine the challenges companies are experiencing while trying to implement self-service business intelligence initiatives through bleeding edge BI tools. Data anarchy is a real threat for many companies who jump on the band wagon of self-service enabled BI tools. I will end the series with practical recommendations for companies to avoid data anarchy.

Part 1: What is Data Anarchy?

Companies today feel the increasing need for gathering business insights from their data, and this is transforming the BI landscape. Many are looking for simple to use and easy to deploy self-service enabled BI tools to get results, fast.  One of the common complaints of business users is that traditional tools have a steep learning curve and are not intuitive enough to feed data and extract insights within minutes.

Also, as the “moneyball” effect sweeps organizations, business managers try to innovate using data analytics. They want to milk the data they have to the utmost to gain insights about buying behaviors of their customers at an ever deeper level. Widespread adoption of mobile technology and social computing has driven interest in visualization capabilities and real-time analytics. And companies cannot survive (let alone prosper) without recognizing that social as a phenomenon can allow them to redefine their organizations to be inherently more fast fluid and flexible by its very design. There is some relief provided by new in-memory enabled technologies like Qlikview and Tableau but it often comes at the cost of temporarily suspending data management rules, policies or procedures leading to data anarchy.

Companies are susceptible to data anarchy arising from the growing and often hastily implemented new BI tools without thoughtfully planned data management. The effects of data anarchy are more severe for SMBs than for enterprises because enterprise size companies generally have already experienced data anarchy caused by the proliferation of data marts and departmental DWs and they are in the process of adopting robust MDM strategies to address that. But they now need to comprehend the data anarchy caused by the new BI tools as well as part of their MDM strategy.

Most of the new self-service BI tools ingest data into memory using a simple tabular format and further compress it. The ingestion process typically uses some proprietary mechanism to load the data quickly using its own unique join schema. In effect each ingestion process is now creating a unique instance of a data cube. Thus, every time a user needs to bring in new data (which includes new associations/joins and new data entities) the tool has to be re-run to create a new data cube. This approach leads to data anarchy!

The stages of Data anarchy include:

  • Stage 1: During this stage users are typically composing new reports and dashboards out of existing reports. In most of the cases the original data model is preserved and there is a limited possibility that a new data is created since all the insights are constructed using existing data sets.
  • Stage 2: In this stage users extract new data sets from the source to develop new reports and dashboards. This is where IT starts losing control of the master data rules and processes. Depending upon the type of data set created the original model may be partially or totally compromised at this point.
  • Stage 3: This is the stage where users start bringing in totally new data which they then mash up with existing data sets to create insights.
  • Stage 4: Over time multiple users start maintaining multiple sources of data cubes created from the master data and at this stage it is a data management nightmare even for the end user! There is no single version of truth and reconciling to a single version is a mammoth effort.

Organizations dealing with data anarchy need to ask themselves the following questions:

1) How do organizations prevent the suspension of rules, policies, while continuing to meet the demands for time-sensitive business intelligence results?

2) How do organizations manage multiple instances of data? Where is the single version of truth?

3) How to organizations evolve their existing data governance model to be able to address the data anarchy chaos?

4) How do SMB organizations create a data governance model out of existing anarchy? And

5) How can BI solution providers address data anarchy?

Stay tuned for the next post where we explore how we got into this mess!

( I am going to watch the 2012 Presidential election results now!)

I want control of my BI NOW!

Have you ever needed a business insight right away, but couldn’t get it? If yes then you have an age old problem: No instant access to data in a cumbersome IT controlled environment worsened by a steep learning curve to actually use an enterprise BI tool. The answer is not rocket science, its simply Self-Service BI. That means freedom to access data at will along with simple and easy to use BI tool to crank out actionable business insights!

How can we make this happen? How to get IT to embrace Self-Service BI? What are some of the disruptions beyond Self-Service BI?

Stay tuned for a deeper dive into these questions!

Strata 2012: Data Analytics Transformation Continues

This week, I attended the Strata 2012 conference on Big Data hosted by O’Reilly. The theme was ‘Making Data Work’ and 2000+ industry professionals came to the Santa Clara Convention Center to attend sessions and to network. The day one Jump Start Sessions called ‘The missing MBA for Big Data’ discussed various topics spanning from what a data-driven CEO should be to workforce instrumentation. These discussions were interesting from a more philosophical perspective, but lacked specific examples that would have made the arguments more compelling. One really good example of what I would have liked to see a lot more of was the use case presented in the data-driven CEO session of P&G’s investment and their use of Predictive Analytics. P&G has invested in a big data analysis command center using Business Sphere, a visually immersive data environment that has transformed how they make decisions because it allows them to take advantage of global data in real-time.

The exhibition floor bore some unique surprises in terms of new technologies as well as next generations of traditional DB and BI technologies. I visited the Amazon web services booth and saw a demo of DynamoDB which is a NoSQL database service hosted in the cloud. It is a highly available, distributed database cluster architecture. One of the things that hit me during the demo was the key difference between traditional database architectures and NoSQL – while NoSQL gives you the ability to scale and store massive amounts of data  it does come at the cost of compromising some of the traditional database characteristics, such as database schemas and joins.

As expected, Microsoft had a big presence at the expo. They featured everything from their new SQL 2012 server to their cloud-ready analytics platform. A couple of interesting announcements from MS included its plans to make Hadoop data analyzable via both, the Java Script framework and MS Excel as well as their partnership with Datameer supporting Apache Hadoop service on Windows Azure. The MS Excel connector is particularly relevant because it bridges the gap between the developer-centric Hadoop environment use and end-user centric Excel use – essentially bringing Hadoop data to the end user!

Then there were newer companies showcasing their technologies. One of them was Data Sift. Data Sift is a cloud platform which helps customers to do sentiment analysis using social data (ex. Twitter). It is a very unique way of combining social and business insights. As more and more organizations start embracing social media into their GTM strategies, technologies like these will help them bridge the gap between traditional data management solutions and modern-day social analytics.

VMware announced Hadoop support for their SpringSource framework. The first version will simply allow developers to create MapReduce jobs including Hive and Pig connections as well as scheduling. I am looking forward to seeing their broader vision for the use of data analytics in their mainstream products.

My personal key takeaways from Strata 2012 are:

  1. Discussions on Big Data are much more valuable if founded on customer needs rather than technology capabilities.
  2. Let’s not forget about data federation! As the number of data sources keep multiplying enterprises should start focusing their energy on The Big Picture, i.e. how to use the data to enable them to make business decisions.
  3. This space is in a critical phase of development. There is a huge demand for the right skills evidenced by the flocking of programmers to these conferences.
  4. Many vendors at the conference (MarkLogic, MapR, Hadapt, Revolution Analytics, Datameer, Horton Works, Karmasphere) claim that their technologies complement Hadoop but there is no indication of when Hadoop will become mainstream in enterprise ITs. However, VMware and MS’s announcements at the conference indicate that there is an early effort to begin mainstreaming Hadoop.
  5. NoSQL databases are not getting major traction, yet.

The “Big” in Big Data

Over the last year, many industry analysts have tried to define Big Data. Some of the common dimensions that have been used to define Big Data are the 3 V’s, Volume, Velocity and Variety. (Volume = multiple terabytes or over a petabyte; variety = numbers, audio, video, text, streams, weblogs, social media etc.; velocity = the speed with which it is collected). Although the 3 V’s do a good job as parameters for Big Data there are other things at play that need to be captured to understand the true nature of Big Data. In short, to describe the data landscape more holistically, we need to step beyond the 3 V’s. While the 3V’s are better classified as the salient features of the data, the real drivers of the Big Data are technology, economics and the tangible value that can be extracted from the data, in other words the business insights!

Here I want to take a closer look at some of the drivers of Big Data.

Technology:

Big Data analysis requires processing huge volumes of data sets that are non-relational with a weak schema, at an extremely fast pace. This need sparked a sudden emergence of technologies like Hadoop that help to pre-process unstructured data on the fly and perform quick exploratory analytics. This model breaks away from the traditional approach of using procedural code and state management to manage transactions.

Along with new preprocessing technologies we have also seen the growth of alternate DBMS technologies like NoSQL and NewSQL that further help to analyze large chunks of data in non-traditional structures (for example using trees, graphs, or key-value pairs instead of tables.)

Other changes are happening on the infrastructure side of things. High performance and highly scalable architectures have been emerging. They include parallel processing, high-speed networking and fast I/O storage, which further help to process large volumes of data at a higher MB/s rate.

In addition to the technological changes we are also witnessing a fundamental paradigm shift in the way DBA’s and data architects are analyzing data. For example, instead of enforcing ACID (atomicity, consistency, isolation, durability) compliance across all database transactions we are seeing a more flexible approach on using ACID in terms of enforcing it whenever necessary and eventually designing a  consistent system in a more iterative fashion.

Economics:

The emergence of these new technologies is further fueled by the economics associated with providing highly scalable business analytics solutions at a low cost. Hadoop comes to mind as the prime example. I found a valuable white paper that describes how to build a three node Hadoop solution using a Dell OptiPlex desktop PC running Linux as a master machine (http://www.usenix.org/publications/login/2010-02/openpdfs/leidner.pdf). The solution was priced at <$5000.

These kinds of economics are driving a faster adoption of new technologies using off the shelf hardware. Thus enabling even a research scientist or a college student to easily re-purpose his hardware for trying out new software frameworks.

Business Insights:

I cannot stress enough the importance of business insights, also highlighted in my previous blog post (Business Intelligence: The Big Picture). Even as enterprises keep getting smarter at managing their data, they must realize that no matter how small or big their data set is, the true value of the data is realized only when they have produced actionable information (insights)! With this in mind, we must view the implementation of Big Data architectures as incomplete until the data has been analyzed to report out the actual actionable information to its users. Some examples of successful business insights implementations include (but are not limited to):

  • Recommendation engines: increase average order size by recommending complementary products based on predictive analysis for cross-selling (commonly seen on Amazon, Ebay and other online retail websites)
  • Social media intelligence: one of the most powerful use cases I have witnessed recently is the MicroStrategy Gateway application that lets enterprises combine their corporate view with a customer’s Facebook view
  • Customer loyalty programs: many prominent insurance companies have implemented these solutions to gather useful customer trends
  • Large-scale clickstream analytics: many ecommerce websites use clickstream analytics to correlate customer demographic information with their buying behavior.

The takeaway here is that enterprises should remain focused on the value their data can provide in terms of enabling them to make intelligent business decisions. So it important to have this holistic view that does not emphasize certain parameters related to Big Data to the detriment of others. In other words businesses have to keep in the mind the big picture. So how do you measure the impact of  a Big Data implementation for your organization?

Business Intelligence: The Big Picture

There is a lot of buzz about Hadoop, NoSQL, NewSQL and columnar MPP databases. But where is the actual value for businesses? Businesses need to have actionable information derived from their data that they collect on a regular basis. We know how to collect data and store them in databases of various kinds. We have seen the evolutions of SQL databases over the last five decades and databases have gotten sophisticated in terms of processing structured data. With the recent explosion of social media and with it the proliferation of unstructured data, new technologies have emerged, such as MapReduce. So now we have the data but the real question is where does the business value actually get delivered? The answer is simple. The value does not lie in the way data gets pulled into the database or how the database is optimized to handle new varieties of data. While these steps are important the value continues to be delivered at the Analytics and the end user Reporting layer as illustrated in the Business Intelligence value pyramid.


© image shree dandekar 12/6/2011

Rewind << for a second:

The 1990 era was all about capturing business relevant data, storing it using business constructs into a database. Typical use cases involved performing OLTP (Online Transaction processing) workloads on that data. We saw the evolution of Data Warehouses as enterprises started to seek out more analytical insights from the data stored in the database which gave rise to OLAP (Online analytics processing) workloads. Once in the data warehouse the data was cleansed, filtered and augmented with Business rules using some traditional ETL (Extract, Transform, Load) or Data Integration tools, thus removing any redundancies from the data as well as normalizing it. You would still have to run a Business Intelligence capability against this data to develop dashboards or reports to actually be able to derive some business insight from this data. Enterprises could also decide to further perform detailed trend analysis, forecasting using advanced data mining tools.

Fast fwd >> to today:

As EDW’s started getting bigger in size IT soon realized that managing a monolithic data warehouse was cumbersome. Hence the birth of departmental and function specific data marts. But that was not enough since they did not address the core issues of scalability, performance, agility and the ability to handle large volume transactions. Over the years some viable alternates like Database sharding have been used but even that have limited success in terms of scalability. Also it is noteworthy to mention that some of these core issues spawned from the actual limitations of the underlying DBMS’s like MySQL not being able to scale.

Hence investigating alternate DBMS technologies to address these issues has been a focal point of IT managers. So we continue to see the emergence of new DBMS technologies like NoSQL and NewSQL. Similarly we have seen the emergence of MapReduce (Hadoop) in the area of handling unstructured data. The core use case for MapReduce remains in its ability to store massive amounts of data, pre-process it and perform exploratory analytics.

The reality for enterprises is that there are now multiple types of databases in the form of EDW, data marts, columnar MPP stores as well as MapReduce clusters. This ecosystem is being commonly referred to by some industry analysts as Data Lakes.

So if you step back and look at the broader BI space you will notice that there is a lot of effort being spent on getting the plumbing right so that the data (structured as well as unstructured) is massaged and primed. While businesses continue to figure out the optimal data management solution they should not do it without investing in analytics and reporting capabilities needed to extract actionable insights.

I will expand on the reporting and analytics layer in my next post. Specifically trying to address self-service and new technology disruptions like in-memory.

Also the value pyramid assumes an on-premise business intelligence architecture. I will address the Cloud intercept in subsequent posts.